Your portfolio,
supported by AI

Athena is an operating system to help you track, research, manage, and find investment opportunities.

Install via pip $ pip install athenaos

Get notified about new features and updates    

This is an experimental toolkit. It should be used to inform your research and does not represent any sort of official investment advice.

Track positions and portfolio performance in real time.

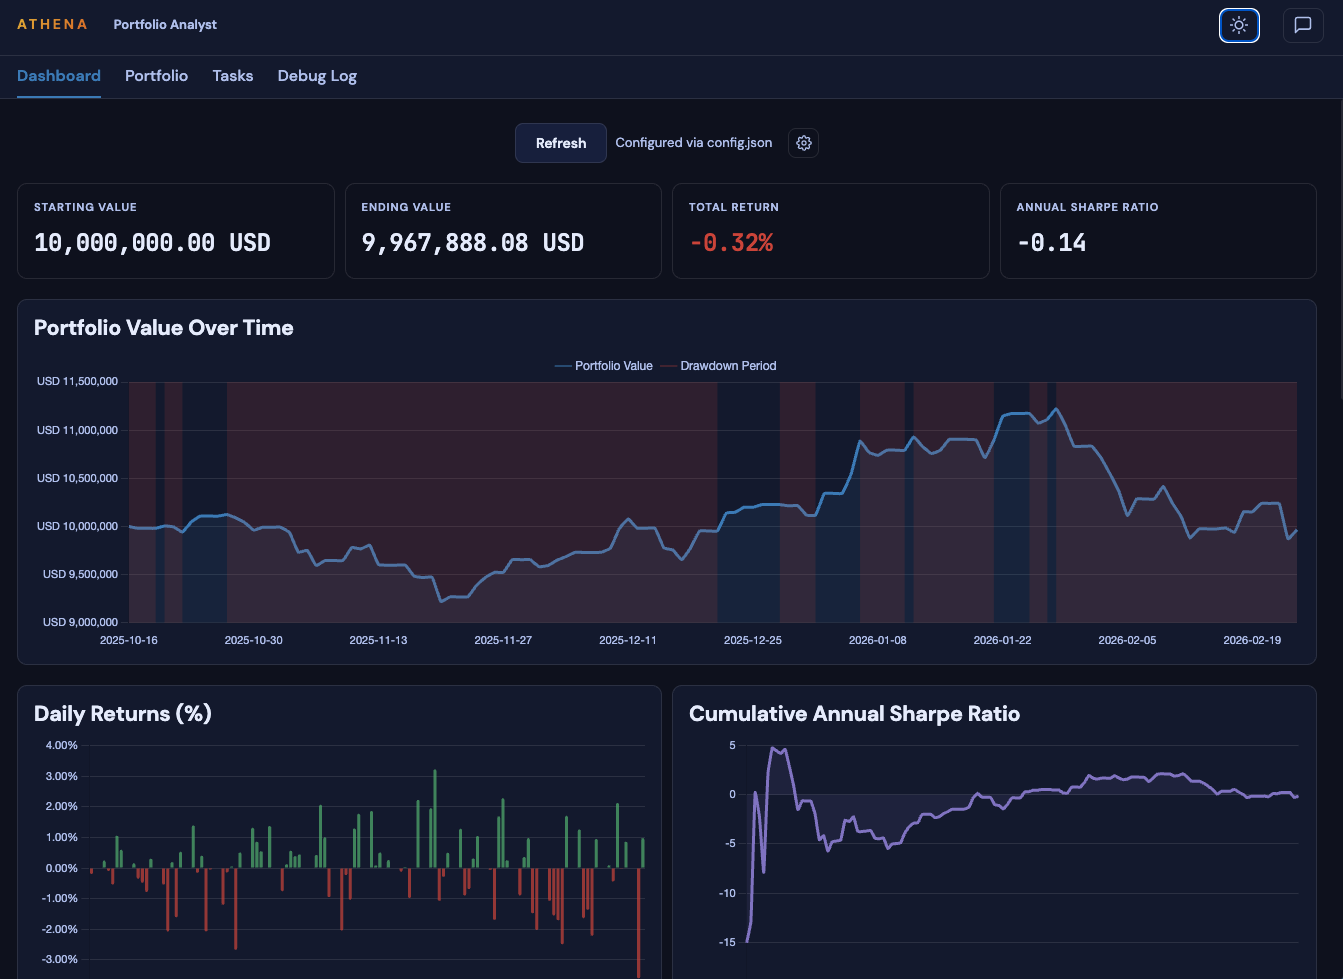
See open positions, book vs market values, gain/loss percentages, and total portfolio value at a glance.

athenaos report
$ athenaos report portfolio.xlsx --no-cache --ignore-errors ATHENA โ€” Agentic Toolkit for Holistic Economic Narratives and Analysis Open Positions on 2026-02-20 09:30 EST โ”โ”โ”โ”โ”โ”โ”โ”โ”โ”โ”ณโ”โ”โ”โ”โ”โ”โ”โ”โ”โ”โ”ณโ”โ”โ”โ”โ”โ”โ”โ”โ”โ”โ”โ”โ”โ”โ”โ”โ”โ”ณโ”โ”โ”โ”โ”โ”โ”โ”โ”โ”โ”โ”โ”โ”โ”โ”โ”โ”โ”ณโ”โ”โ”โ”โ”โ”โ”โ”โ”โ”โ”โ”โ”โ”โ”โ”โ”โ”โ”โ”โ”ณโ”โ”โ”โ”โ”โ”โ”โ”โ”โ”โ”โ”โ”โ”“ โ”ƒ โ”ƒ โ”ƒ Unit Price โ”ƒ โ”ƒ โ”ƒ โ”ƒ โ”ƒ Symbol โ”ƒ Quantity โ”ƒ (Book โ†’ Market) โ”ƒ Book Value (USD) โ”ƒ Market Value (USD) โ”ƒ Gain/Loss % โ”ƒ โ”กโ”โ”โ”โ”โ”โ”โ”โ”โ”โ•‡โ”โ”โ”โ”โ”โ”โ”โ”โ”โ”โ•‡โ”โ”โ”โ”โ”โ”โ”โ”โ”โ”โ”โ”โ”โ”โ”โ”โ”โ•‡โ”โ”โ”โ”โ”โ”โ”โ”โ”โ”โ”โ”โ”โ”โ”โ”โ”โ”โ•‡โ”โ”โ”โ”โ”โ”โ”โ”โ”โ”โ”โ”โ”โ”โ”โ”โ”โ”โ”โ”โ•‡โ”โ”โ”โ”โ”โ”โ”โ”โ”โ”โ”โ”โ”โ”ฉ โ”‚ 0005.HK โ”‚ 28,000 โ”‚ $14.38 โ†’ $14.55 โ”‚ $402,640.00 โ”‚ $407,400.00 โ”‚ +1.18% โ”‚ โ”‚ 0700.HK โ”‚ 4,200 โ”‚ $31.42 โ†’ $96.15 โ”‚ $131,964.00 โ”‚ $403,830.00 โ”‚ +205.97% โ”‚ โ”‚ 1810.HK โ”‚ 15,500 โ”‚ $6.18 โ†’ $5.97 โ”‚ $95,790.00 โ”‚ $92,535.00 โ”‚ -3.40% โ”‚ โ””โ”€โ”€โ”€โ”€โ”€โ”€โ”€โ”€โ”€โ”ดโ”€โ”€โ”€โ”€โ”€โ”€โ”€โ”€โ”€โ”€โ”ดโ”€โ”€โ”€โ”€โ”€โ”€โ”€โ”€โ”€โ”€โ”€โ”€โ”€โ”€โ”€โ”€โ”€โ”ดโ”€โ”€โ”€โ”€โ”€โ”€โ”€โ”€โ”€โ”€โ”€โ”€โ”€โ”€โ”€โ”€โ”€โ”€โ”ดโ”€โ”€โ”€โ”€โ”€โ”€โ”€โ”€โ”€โ”€โ”€โ”€โ”€โ”€โ”€โ”€โ”€โ”€โ”€โ”€โ”ดโ”€โ”€โ”€โ”€โ”€โ”€โ”€โ”€โ”€โ”€โ”€โ”€โ”€โ”˜ Cash Balances โ”โ”โ”โ”โ”โ”โ”โ”โ”โ”โ”โ”ณโ”โ”โ”โ”โ”โ”โ”โ”โ”โ”“ โ”ƒ Currency โ”ƒ Balance โ”ƒ โ”กโ”โ”โ”โ”โ”โ”โ”โ”โ”โ”โ•‡โ”โ”โ”โ”โ”โ”โ”โ”โ”โ”ฉ โ”‚ USD โ”‚ -0.00 โ”‚ โ””โ”€โ”€โ”€โ”€โ”€โ”€โ”€โ”€โ”€โ”€โ”ดโ”€โ”€โ”€โ”€โ”€โ”€โ”€โ”€โ”€โ”˜ โ•ญโ”€โ”€โ”€โ”€โ”€โ”€โ”€โ”€โ”€โ”€โ”€โ”€โ”€โ”€โ”€โ”€โ”€โ”€โ”€โ”€โ”€โ”€โ”€โ”€โ”€โ”€โ”€โ”€โ”€โ”€โ”€โ”€โ”€โ”€โ”€โ”€โ”€โ”€โ”€โ”€ Summary โ”€โ”€โ”€โ”€โ”€โ”€โ”€โ”€โ”€โ”€โ”€โ”€โ”€โ”€โ”€โ”€โ”€โ”€โ”€โ”€โ”€โ”€โ”€โ”€โ”€โ”€โ”€โ”€โ”€โ”€โ”€โ”€โ”€โ”€โ”€โ”€โ”€โ”€โ”€โ”€โ”€โ•ฎ โ”‚ Total Portfolio Value: $903,765.00 โ”‚ โ•ฐโ”€โ”€โ”€โ”€โ”€โ”€โ”€โ”€โ”€โ”€โ”€โ”€โ”€โ”€โ”€โ”€โ”€โ”€โ”€โ”€โ”€โ”€โ”€โ”€โ”€โ”€โ”€โ”€โ”€โ”€โ”€โ”€โ”€โ”€โ”€โ”€โ”€โ”€โ”€โ”€โ”€โ”€โ”€โ”€โ”€โ”€โ”€โ”€โ”€โ”€โ”€โ”€โ”€โ”€โ”€โ”€โ”€โ”€โ”€โ”€โ”€โ”€โ”€โ”€โ”€โ”€โ”€โ”€โ”€โ”€โ”€โ”€โ”€โ”€โ”€โ”€โ”€โ”€โ”€โ”€โ”€โ”€โ”€โ”€โ”€โ”€โ”€โ”€โ”€โ•ฏ

Calculate hedge fund metrics like Sharpe, Sortino, drawdowns, and more.

Benchmark your portfolio against the S&P 500 and NASDAQ with institutional-grade risk and return metrics.

athenaos metrics
$ athenaos metrics my-portfolio.xlsx --no-cache --ignore-errors ATHENA โ€” Agentic Toolkit for Holistic Economic Narratives and Analysis Portfolio Metrics Report - 2026-02-20 09:31 EST Currency: USD | Risk-Free Rate: 5.00% | Confidence: 95% Risk-Adjusted Return Metrics โ”โ”โ”โ”โ”โ”โ”โ”โ”โ”โ”โ”โ”โ”โ”โ”โ”โ”โ”โ”โ”โ”โ”ณโ”โ”โ”โ”โ”โ”โ”โ”โ”โ”ณโ”โ”โ”โ”โ”โ”โ”โ”โ”โ”โ”โ”โ”“ โ”ƒ Metric โ”ƒ Daily โ”ƒ Annualized โ”ƒ โ”กโ”โ”โ”โ”โ”โ”โ”โ”โ”โ”โ”โ”โ”โ”โ”โ”โ”โ”โ”โ”โ”โ•‡โ”โ”โ”โ”โ”โ”โ”โ”โ”โ•‡โ”โ”โ”โ”โ”โ”โ”โ”โ”โ”โ”โ”โ”ฉ โ”‚ Sharpe Ratio โ”‚ -0.0168 โ”‚ -0.3215 โ”‚ โ”‚ Sharpe Ratio (DTB3) โ”‚ -0.0153 โ”‚ -0.2428 โ”‚ โ”‚ Sortino Ratio โ”‚ -0.0224 โ”‚ -0.4287 โ”‚ โ””โ”€โ”€โ”€โ”€โ”€โ”€โ”€โ”€โ”€โ”€โ”€โ”€โ”€โ”€โ”€โ”€โ”€โ”€โ”€โ”€โ”€โ”ดโ”€โ”€โ”€โ”€โ”€โ”€โ”€โ”€โ”€โ”ดโ”€โ”€โ”€โ”€โ”€โ”€โ”€โ”€โ”€โ”€โ”€โ”€โ”˜ Alpha & Beta (vs Market Benchmarks) โ”โ”โ”โ”โ”โ”โ”โ”โ”โ”โ”โ”โ”โ”โ”โ”โ”โ”โ”ณโ”โ”โ”โ”โ”โ”โ”โ”โ”โ”โ”โ”โ”โ”โ”โ”โ”ณโ”โ”โ”โ”โ”โ”โ”ณโ”โ”โ”โ”โ”โ”โ”โ”โ”“ โ”ƒ Benchmark โ”ƒ Alpha (Annual) โ”ƒ Beta โ”ƒ Rยฒ โ”ƒ โ”กโ”โ”โ”โ”โ”โ”โ”โ”โ”โ”โ”โ”โ”โ”โ”โ”โ”โ•‡โ”โ”โ”โ”โ”โ”โ”โ”โ”โ”โ”โ”โ”โ”โ”โ”โ•‡โ”โ”โ”โ”โ”โ”โ•‡โ”โ”โ”โ”โ”โ”โ”โ”โ”ฉ โ”‚ S&P 500 (^GSPC) โ”‚ -12.45% โ”‚ 1.24 โ”‚ 54.83% โ”‚ โ”‚ NASDAQ (^IXIC) โ”‚ -3.51% โ”‚ 0.86 โ”‚ 49.72% โ”‚ โ””โ”€โ”€โ”€โ”€โ”€โ”€โ”€โ”€โ”€โ”€โ”€โ”€โ”€โ”€โ”€โ”€โ”€โ”ดโ”€โ”€โ”€โ”€โ”€โ”€โ”€โ”€โ”€โ”€โ”€โ”€โ”€โ”€โ”€โ”€โ”ดโ”€โ”€โ”€โ”€โ”€โ”€โ”ดโ”€โ”€โ”€โ”€โ”€โ”€โ”€โ”€โ”˜ Volatility Metrics โ”โ”โ”โ”โ”โ”โ”โ”โ”โ”โ”โ”โ”โ”โ”โ”โ”โ”โ”โ”โ”โ”โ”ณโ”โ”โ”โ”โ”โ”โ”โ”ณโ”โ”โ”โ”โ”โ”โ”โ”โ”โ”โ”โ”โ”“ โ”ƒ Metric โ”ƒ Daily โ”ƒ Annualized โ”ƒ โ”กโ”โ”โ”โ”โ”โ”โ”โ”โ”โ”โ”โ”โ”โ”โ”โ”โ”โ”โ”โ”โ”โ•‡โ”โ”โ”โ”โ”โ”โ”โ•‡โ”โ”โ”โ”โ”โ”โ”โ”โ”โ”โ”โ”โ”ฉ โ”‚ Total Volatility โ”‚ 1.12% โ”‚ 21.38% โ”‚ โ”‚ Upside Volatility โ”‚ 0.78% โ”‚ 14.89% โ”‚ โ”‚ Downside Volatility โ”‚ 0.93% โ”‚ 17.75% โ”‚ โ””โ”€โ”€โ”€โ”€โ”€โ”€โ”€โ”€โ”€โ”€โ”€โ”€โ”€โ”€โ”€โ”€โ”€โ”€โ”€โ”€โ”€โ”ดโ”€โ”€โ”€โ”€โ”€โ”€โ”€โ”ดโ”€โ”€โ”€โ”€โ”€โ”€โ”€โ”€โ”€โ”€โ”€โ”€โ”˜ Volatility Ratio (Down/Up): 1.1923 - More downside variability Drawdown Metrics โ”โ”โ”โ”โ”โ”โ”โ”โ”โ”โ”โ”โ”โ”โ”โ”โ”โ”โ”โ”ณโ”โ”โ”โ”โ”โ”โ”โ”โ”โ”ณโ”โ”โ”โ”โ”โ”โ”โ”โ”โ”โ”โ”โ”โ”โ”โ”โ”โ”โ”โ”โ”โ”โ”โ”โ”โ”โ”โ”โ”โ”โ”โ”โ”โ”โ”โ”โ”โ”โ”โ”“ โ”ƒ Metric โ”ƒ Value โ”ƒ Details โ”ƒ โ”กโ”โ”โ”โ”โ”โ”โ”โ”โ”โ”โ”โ”โ”โ”โ”โ”โ”โ”โ•‡โ”โ”โ”โ”โ”โ”โ”โ”โ”โ•‡โ”โ”โ”โ”โ”โ”โ”โ”โ”โ”โ”โ”โ”โ”โ”โ”โ”โ”โ”โ”โ”โ”โ”โ”โ”โ”โ”โ”โ”โ”โ”โ”โ”โ”โ”โ”โ”โ”โ”โ”ฉ โ”‚ Maximum Drawdown โ”‚ -14.32% โ”‚ Peak: 2025-11-15 โ†’ Trough: 2025-12-22 โ”‚ โ””โ”€โ”€โ”€โ”€โ”€โ”€โ”€โ”€โ”€โ”€โ”€โ”€โ”€โ”€โ”€โ”€โ”€โ”€โ”ดโ”€โ”€โ”€โ”€โ”€โ”€โ”€โ”€โ”€โ”ดโ”€โ”€โ”€โ”€โ”€โ”€โ”€โ”€โ”€โ”€โ”€โ”€โ”€โ”€โ”€โ”€โ”€โ”€โ”€โ”€โ”€โ”€โ”€โ”€โ”€โ”€โ”€โ”€โ”€โ”€โ”€โ”€โ”€โ”€โ”€โ”€โ”€โ”€โ”€โ”˜ Value at Risk (95% Confidence) โ”โ”โ”โ”โ”โ”โ”โ”โ”โ”โ”โ”โ”โ”โ”โ”โ”โ”โ”โ”โ”โ”โ”โ”โ”โ”ณโ”โ”โ”โ”โ”โ”โ”โ”โ”โ”โ”โ”โ”ณโ”โ”โ”โ”โ”โ”โ”โ”โ”โ”โ”โ”โ”“ โ”ƒ Metric โ”ƒ Historical โ”ƒ Parametric โ”ƒ โ”กโ”โ”โ”โ”โ”โ”โ”โ”โ”โ”โ”โ”โ”โ”โ”โ”โ”โ”โ”โ”โ”โ”โ”โ”โ•‡โ”โ”โ”โ”โ”โ”โ”โ”โ”โ”โ”โ”โ•‡โ”โ”โ”โ”โ”โ”โ”โ”โ”โ”โ”โ”โ”ฉ โ”‚ Value at Risk (VaR) โ”‚ -2.18% โ”‚ -1.89% โ”‚ โ”‚ Conditional VaR (CVaR) โ”‚ -2.67% โ”‚ -2.57% โ”‚ โ””โ”€โ”€โ”€โ”€โ”€โ”€โ”€โ”€โ”€โ”€โ”€โ”€โ”€โ”€โ”€โ”€โ”€โ”€โ”€โ”€โ”€โ”€โ”€โ”€โ”ดโ”€โ”€โ”€โ”€โ”€โ”€โ”€โ”€โ”€โ”€โ”€โ”€โ”ดโ”€โ”€โ”€โ”€โ”€โ”€โ”€โ”€โ”€โ”€โ”€โ”€โ”˜ Win Rate Metrics โ”โ”โ”โ”โ”โ”โ”โ”โ”โ”โ”โ”โ”โ”โ”โ”โ”โ”โ”ณโ”โ”โ”โ”โ”โ”โ”โ”โ”โ”โ”โ”โ”โ”โ”โ”โ”โ”โ”ณโ”โ”โ”โ”โ”โ”โ”โ”โ”โ”โ”โ”โ”โ”โ”โ”“ โ”ƒ Metric โ”ƒ Closed Positions โ”ƒ All Positions โ”ƒ โ”กโ”โ”โ”โ”โ”โ”โ”โ”โ”โ”โ”โ”โ”โ”โ”โ”โ”โ•‡โ”โ”โ”โ”โ”โ”โ”โ”โ”โ”โ”โ”โ”โ”โ”โ”โ”โ”โ•‡โ”โ”โ”โ”โ”โ”โ”โ”โ”โ”โ”โ”โ”โ”โ”โ”ฉ โ”‚ Win Rate โ”‚ 83.3% โ”‚ 41.2% โ”‚ โ”‚ Total Positions โ”‚ 12 โ”‚ 34 โ”‚ โ”‚ Winning โ”‚ 10 โ”‚ 14 โ”‚ โ”‚ Losing โ”‚ 2 โ”‚ 20 โ”‚ โ”‚ Breakeven โ”‚ 0 โ”‚ 0 โ”‚ โ”‚ Average Win โ”‚ $52,415.23 โ”‚ $84,672.40 โ”‚ โ”‚ Average Loss โ”‚ $-5,180.00 โ”‚ $-63,248.15 โ”‚ โ”‚ Win/Loss Ratio โ”‚ 10.12 โ”‚ 1.34 โ”‚ โ”‚ Total Gain/Loss โ”‚ $518,972.28 โ”‚ $-101,290.60 โ”‚ โ””โ”€โ”€โ”€โ”€โ”€โ”€โ”€โ”€โ”€โ”€โ”€โ”€โ”€โ”€โ”€โ”€โ”€โ”ดโ”€โ”€โ”€โ”€โ”€โ”€โ”€โ”€โ”€โ”€โ”€โ”€โ”€โ”€โ”€โ”€โ”€โ”€โ”ดโ”€โ”€โ”€โ”€โ”€โ”€โ”€โ”€โ”€โ”€โ”€โ”€โ”€โ”€โ”€โ”˜ โ•ญโ”€โ”€โ”€โ”€โ”€โ”€โ”€โ”€โ”€โ”€โ”€โ”€โ”€โ”€โ”€โ”€โ”€โ”€โ”€โ”€โ”€โ”€โ”€โ”€โ”€โ”€โ”€โ”€โ”€โ”€โ”€โ”€ Summary Insights โ”€โ”€โ”€โ”€โ”€โ”€โ”€โ”€โ”€โ”€โ”€โ”€โ”€โ”€โ”€โ”€โ”€โ”€โ”€โ”€โ”€โ”€โ”€โ”€โ”€โ”€โ”€โ”€โ”€โ”€โ”€โ”€โ•ฎ โ”‚ โš  Negative risk-adjusted returns (Sharpe < 0) โ”‚ โ”‚ โœ“ Positive win rate on closed positions (83.3%) โ”‚ โ•ฐโ”€โ”€โ”€โ”€โ”€โ”€โ”€โ”€โ”€โ”€โ”€โ”€โ”€โ”€โ”€โ”€โ”€โ”€โ”€โ”€โ”€โ”€โ”€โ”€โ”€โ”€โ”€โ”€โ”€โ”€โ”€โ”€โ”€โ”€โ”€โ”€โ”€โ”€โ”€โ”€โ”€โ”€โ”€โ”€โ”€โ”€โ”€โ”€โ”€โ”€โ”€โ”€โ”€โ”€โ”€โ”€โ”€โ”€โ”€โ”€โ”€โ”€โ”€โ”€โ”€โ”€โ”€โ”€โ”€โ”€โ”€โ”€โ”€โ”€โ”€โ”€โ”€โ”€โ”€โ”€โ”€โ•ฏ

Everything you need to manage a portfolio

From basic position tracking to AI-driven trading agents, Athena gives you hedge-fund-grade tools in a single pip install.

Portfolio Tracking

Track positions, currencies, dividends, fees, and cash flows across your entire portfolio. Data lives in Excel files you control.

Hedge Fund Metrics

Sharpe ratio, max drawdown, and other institutional-grade performance benchmarks calculated automatically from your transactions.

Agentic Trading

LLM-powered agents analyze news, run scenarios, and execute trades. Supports US stocks, CBOE commodities, and meme stock strategies.

Multi-Currency

Native support for 16 currencies including USD, EUR, CAD, JPY, GBP, SGD, and more. Automatic forex conversion and tracking.

Interactive Dashboards

Generate HTML dashboards visualizing portfolio performance, returns, and risk metrics over time. One command, zero dependencies.

AI Chat Frontend

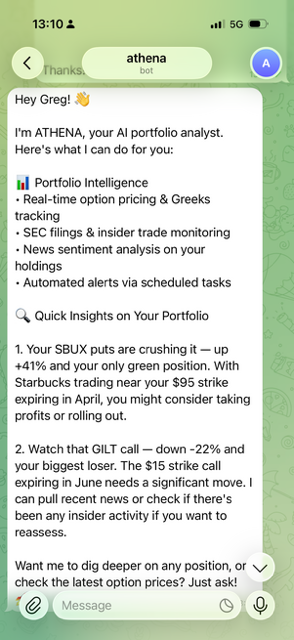
Web UI with AI-powered chat for querying your portfolio. Connect via Telegram for on-the-go access. Extensible gateway system.

Telegram Bot

Run and chat with a Telegram bot to interact with your portfolio on the go. Check positions, run analyses, and trigger trades from your phone.

Commodities, Options & More

Go beyond stocks with support for commodities, options, and other unique financial products. Track and trade across diverse asset classes in one place.

Extensible Framework

A plugin framework for new tools, widgets, and data sources means you can extend Athena to whatever your needs are. Build once, integrate everywhere.

From Excel to AI in three commands

Your data stays in spreadsheets you already know. Athena handles the rest.

1

Track your positions

Log transactions in a simple Excel file with columns for symbol, date, type, price, quantity, and currency. Athena supports buys, sells, dividends, fees, and currency exchanges.

$ athenaos report my_portfolio.xlsx
2

Benchmark your performance

See how you stack up with Sharpe ratio, max drawdown, and other hedge fund metrics. Pull real-time pricing from Yahoo Finance, FRED, and custom data sources.

$ athenaos metrics my_portfolio.xlsx
3

Deploy trading agents

Let LLMs analyze market events, run scenario analyses, and open or close positions. Agents connect to Massive for stocks and DataBento for commodities.

$ athenaos demo --us-stocks my_portfolio.xlsx

LLMs that trade for you

Athena agents monitor events, analyze fundamentals, and execute trades across multiple asset classes.

Analyze fundamentals and news for US-listed equities. Agents pull event data from Emerging Trajectories and execute through the Massive API.

$ athenaos demo --us-stocks your-portfolio.xlsx

Trade CBOE-listed commodities using real-time data from DataBento. Agents monitor global events and adjust positions accordingly.

$ athenaos demo --commodities your-portfolio.xlsx

Sentiment-driven strategies for high-volatility equities. Agents track social signals and momentum to time entries and exits.

$ athenaos demo --meme-stocks your-portfolio.xlsx

Your own data and APIs

Connect to your preferred data sources: Databento, Yahoo! Finance, Massive, FRED, or vibe code your own connectors.

Yahoo Finance
Stock prices & fundamentals
Federal Reserve (FRED)
Economic indicators
SEC Filings
Insider trades & disclosures
Massive API
Stock trading execution
DataBento
Commodities market data
Emerging Trajectories
Events & scenario analysis

Install in seconds

Athena is a Python package. Install it from GitHub and point it at your Excel file.

Installation
# Install from PyPI $ pip install athenaos # Or install from GitHub $ pip install git+https://github.com/wgryc/athena-os.git # Run your first report $ athenaos report sample_transactions.xlsx # Launch the dashboard $ athenaos dashboard sample_transactions.xlsx # Start the AI chat frontend $ athenaos frontend sample_transactions.xlsx

Subscribe for updates

Get notified when we launch new features and updates.